Graph
The Graph tab renders the active binding's expression as a flow diagram of logic gates and leaf nodes.
Overview
The graph is a directed acyclic graph (DAG) where:
- The root node (top) is the expression's output
- Interior nodes are boolean operators (AND, OR, NOT, XOR, →, ↔)
- Leaf nodes are input variables or predicate atoms
The layout is computed automatically using Dagre. Edges flow top-to-bottom.
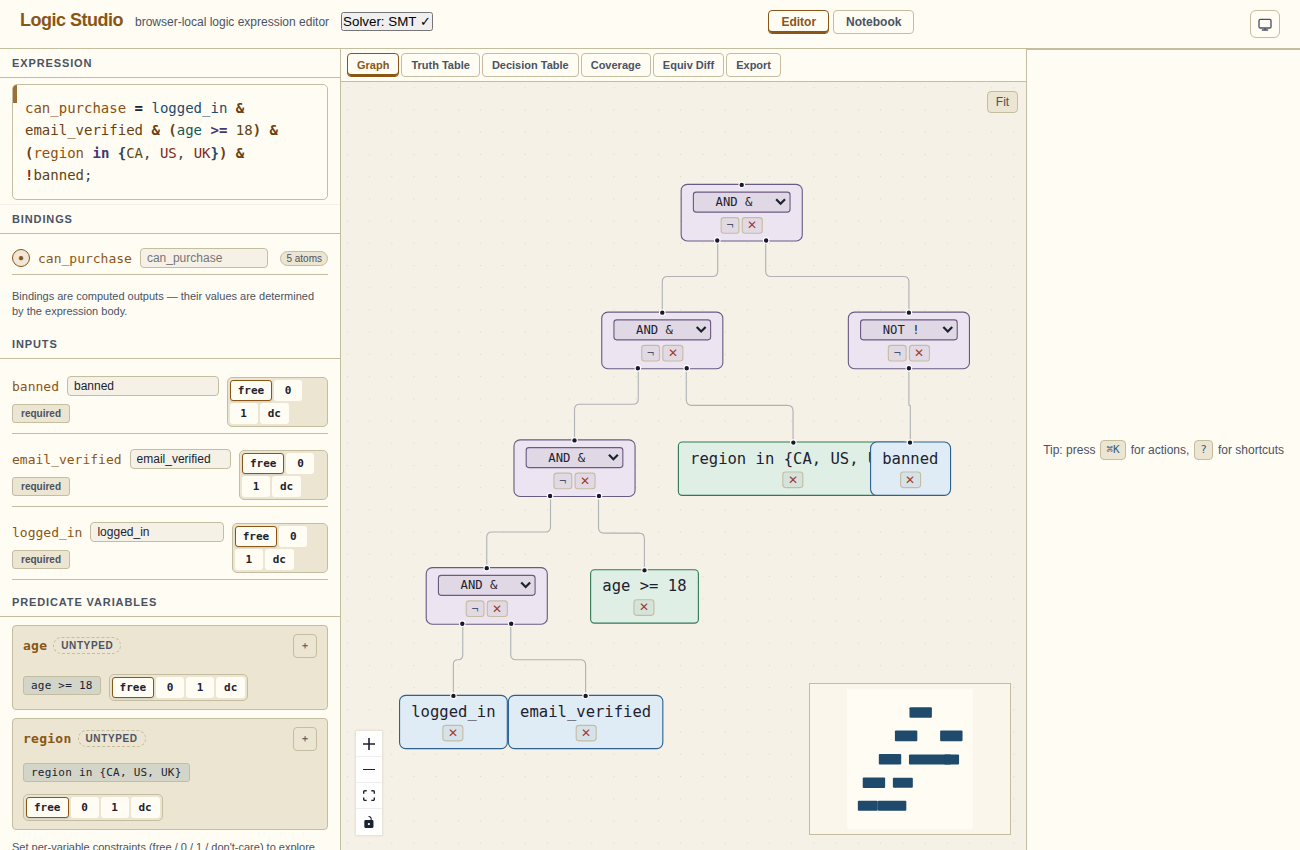
can_purchase = logged_in & email_verified & (age >= 18) & (region in {CA, US, UK}) & !banned.Node types
| Node type | Colour (dark theme) | Description |
|---|---|---|
| Operator (AND, OR, NOT…) | Purple border | Boolean operator. Shows the operator symbol and a dropdown to change the operator. |
| Leaf / variable | Blue border | A boolean input variable. |
| Predicate atom | Green border | A typed comparison like age >= 18. |
Each operator node has a dropdown (▾) that lists alternative operators. Selecting one updates the expression in the editor. There is also a "negate" button (¬) to toggle a NOT around that subexpression, and an × to delete the node.
Canvas controls
- Pan: click and drag on the background
- Zoom: scroll wheel or trackpad pinch
- Fit: the "Fit" button in the top-right re-fits the graph to the visible area
- Zoom controls: + / − / fit buttons on the bottom-left of the canvas
Target bar
For multi-binding programs, a target bar appears above the canvas with a dropdown to select which binding to visualise. Changing it updates the active binding across all panels.
Show-all DAG
Press the "Show all" button in the target bar to render all bindings in a single DAG. Each binding's root is labelled. Shared subexpressions are drawn once and referenced by multiple edges.
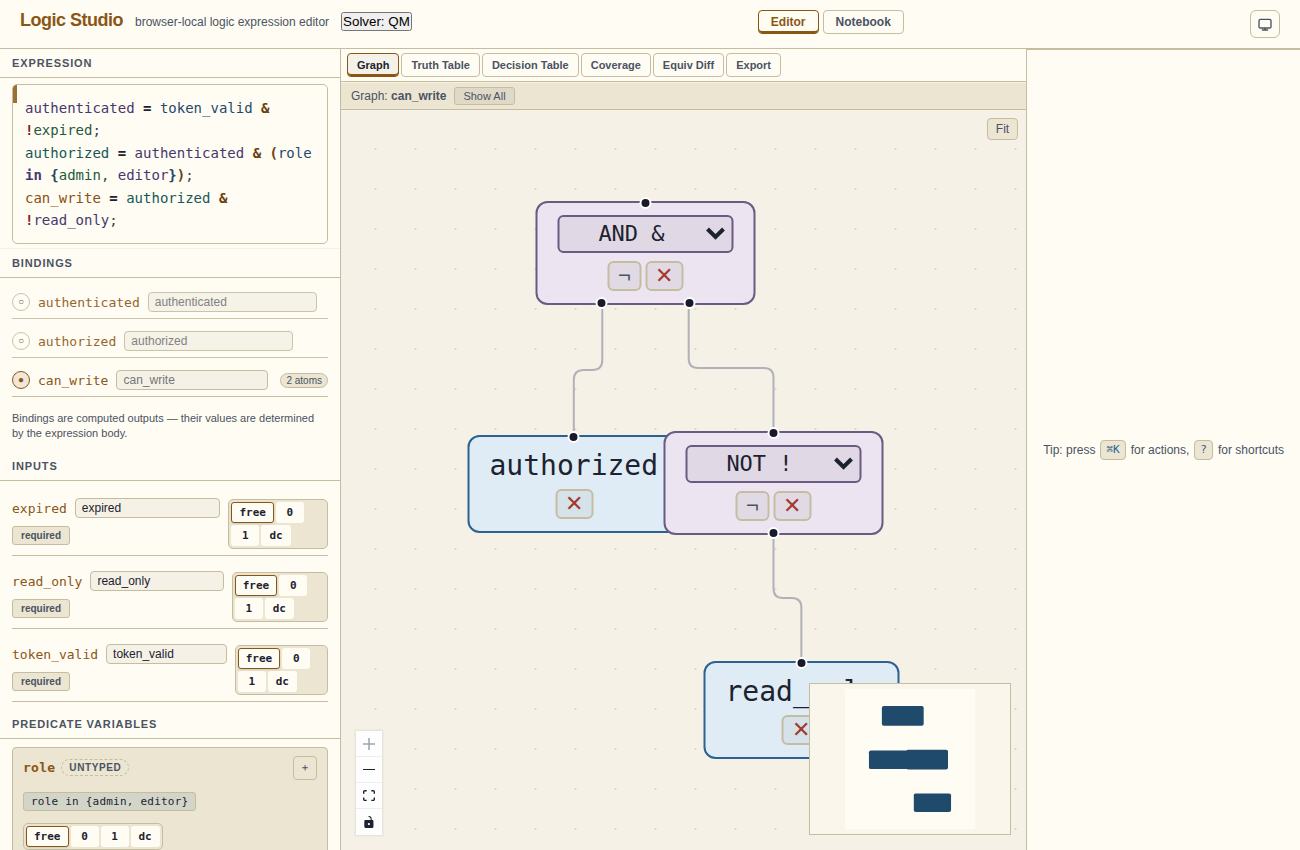
authenticated → authorized → can_write.Minimap
A minimap appears in the bottom-right of the canvas for large graphs. It shows a scaled overview of the full DAG. Click anywhere on the minimap to pan to that region.